Introduction
Every procurement professional knows the frustration: you negotiate hard, secure a price that looks excellent on paper, and then watch the savings erode as freight surges, quality issues multiply, and your compliance team logs overtime on documentation errors.
The invoice price was right. The sourcing decision was wrong.
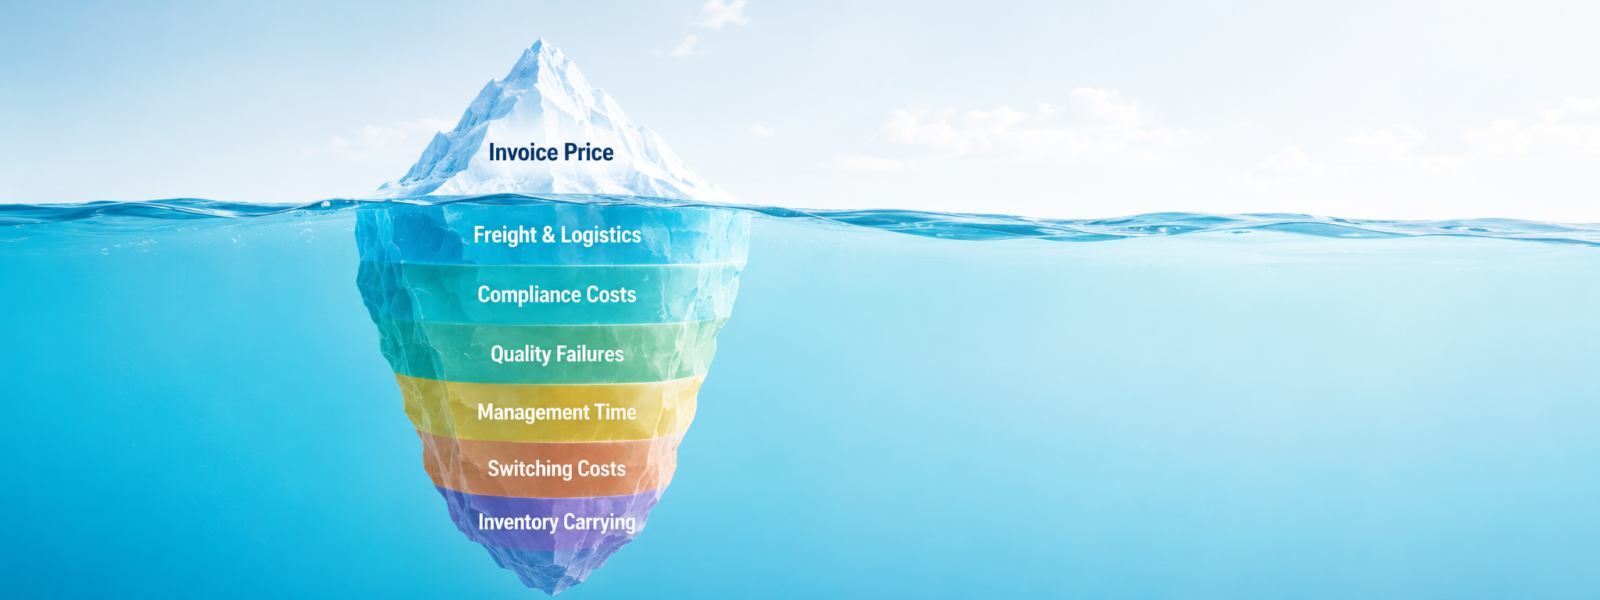
This is the TCO trap — the organisational habit of evaluating supplier performance through a single lens while the real costs accumulate in logistics, quality management, regulatory compliance, and management time. It is a trap that costs food and agri businesses significantly more than the procurement savings it appears to protect.
Total cost of ownership (TCO) is the analytical framework that closes this gap. It forces a comprehensive accounting of every cost associated with a supplier relationship, providing a basis for sourcing decisions that genuinely optimises value rather than simply minimising one line on a purchase order.
For procurement managers and directors sourcing agri commodities — particularly from international origins — TCO analysis is not a theoretical exercise. It is a practical necessity that consistently reveals that the supplier with the lowest invoice price is frequently not the cheapest supplier in the business.
Section 1 — What TCO Includes: The Full Cost Map
A complete TCO model for an agri food commodity supplier covers costs across four broad categories: acquisition, possession, usage, and end-of-life. In practice, for most food procurement contexts, the relevant categories are:
Acquisition Costs (the visible layer)
- Unit purchase price (per kg, litre, or unit)
- Volume-based pricing tiers and MOQ commitments
- Currency exchange costs and hedging expenses
- Payment terms (early payment discounts, late payment penalties)
- Supplier qualification and onboarding costs
Logistics and Delivery Costs (frequently underestimated)
- Freight cost — air, sea, or road, determined by Incoterm
- Port charges, demurrage, and handling fees
- Insurance costs for goods in transit
- Customs brokerage fees
- Duties and import tariffs (determined by HS code and destination)
- Last-mile delivery to warehouse or factory
Compliance and Quality Costs (the hidden layer)
- Incoming quality inspection costs (internal or third-party)
- Laboratory testing costs per batch
- Certification management — tracking, renewal, and audit facilitation
- Border Control Post (BCP) inspection fees for food imports to UK/EU
- Cost of regulatory non-compliance: rejected shipments, fines, recall costs
- Management time spent on documentation review and issue resolution
Relationship and Management Costs (the invisible layer)
- Procurement management time — supplier meetings, performance reviews, negotiations
- Inventory carrying costs — capital cost of stock held, warehousing costs, obsolescence risk
- Safety stock holding — additional inventory held as buffer against supply variability
- Switching costs — the cost of moving to an alternative supplier if this one fails (qualification, sampling, documentation, pilot orders)
- Risk premium — the implicit cost of supply risk that is not captured in any single cost line
Section 2 — The TCO Calculation: A Worked Example
To illustrate the practical impact of TCO analysis, consider two suppliers of cold pressed coconut oil — both offering comparable quality products with similar certifications.
Supplier A — India, established exporter:
– Invoice price: £4.80 per litre
– Lead time: 30 days, consistent
– Documentation error rate: <2%
– Quality rejection rate: <0.5%
– FSSAI, ISO 22000, HACCP, GMP certified
– Proactive communication, designated account manager
Supplier B — Alternative origin:
– Invoice price: £4.45 per litre (7% cheaper)
– Lead time: 35–50 days, variable
– Documentation error rate: 8%
– Quality rejection rate: 2.5%
– FSSAI equivalent — documentation often incomplete
– Reactive communication, issues require escalation
TCO calculation per 10,000 litres:
| Cost Component | Supplier A | Supplier B |
|---|---|---|
| Invoice cost | £48,000 | £44,500 |
| Additional freight (route/Incoterm) | £1,200 | £1,800 |
| Documentation correction costs | £200 | £900 |
| Quality inspection (higher frequency) | £300 | £600 |
| Quality rejection (0.5% vs 2.5%) | £240 | £1,113 |
| Management time (hours × rate) | £400 | £1,200 |
| Safety stock carrying cost (variability) | £300 | £900 |
| Border inspection risk provision | £150 | £600 |
| Total TCO | £50,790 | £51,613 |
The supplier with a 7% lower invoice price costs 1.6% more on a total cost basis — before accounting for the reputational and relationship costs of quality and documentation failures.
This is not an unusual result. Across agri commodity procurement, TCO analysis routinely reveals that apparent price savings of 5–10% are fully or partially offset by higher costs elsewhere in the supply chain.
Section 3 — The Quality Failure Cost: Frequently the Largest Hidden Item
Of all the hidden costs in agri commodity procurement, quality failures are typically the most significant and the most avoidable.
The cost of a rejected shipment extends far beyond the value of the goods themselves:
- Direct cost: the product must be returned, disposed of, or reworked — none of which is free
- Freight cost: the shipment travelled to your warehouse or port and must now move again
- Downtime cost: if the rejected product was a production input, your production line may be halted until replacement stock arrives
- Emergency procurement premium: sourcing replacement product at short notice typically costs 10–25% more than planned procurement
- Regulatory risk: if sub-specification product has already entered the supply chain, the costs of recall, regulatory notification, and potential fines can dwarf the value of the original shipment
- Customer relationship cost: if a quality failure reaches your customer, the relationship consequences are rarely captured in any financial model but are often the most damaging outcome
For food and agri buyers, this means that a supplier’s quality rejection rate is one of the highest-value metrics to track. Moving from a 3% to a 0.5% quality rejection rate on a £500,000 annual spend saves £12,500 in direct costs and avoids the disproportionate tail costs associated with periodic failures.
Section 4 — Logistics Cost Volatility: Why Incoterms Matter More Than You Think
The Incoterm governing a supply contract determines where the transfer of cost and risk occurs between supplier and buyer. For international agri commodity procurement, this is a major driver of TCO — and one that is frequently negotiated without rigorous financial modelling.
The Incoterm cost implications:
- EXW (Ex Works): the buyer bears all freight, insurance, export documentation, and customs costs. This gives maximum control but maximum cost exposure and logistical complexity.
- FOB (Free On Board): the supplier covers costs to the origin port; the buyer covers ocean freight, insurance, and destination costs. Common for bulk commodity trades.
- CIF (Cost, Insurance, Freight): the supplier covers ocean freight and insurance to destination port. Simpler for the buyer but removes visibility and control over freight costs.
- DDP (Delivered Duty Paid): the supplier bears all costs including destination duties. Maximum simplicity for the buyer; maximum cost for the supplier, which is typically reflected in the unit price.
For buyers importing agri commodities from India to the UK, EU, or UAE, FOB or CIF terms are most common. The choice between them has meaningful cost implications depending on current freight market conditions — in periods of high freight rate volatility (as experienced in 2021–2022 and again in 2024), CIF terms that lock in the supplier’s freight cost can protect against rate surges.
Include freight cost modelling in your TCO analysis, and revisit the optimal Incoterm at contract renewal as freight market conditions change.
Section 5 — Compliance Costs: Regulatory Complexity as a TCO Driver
Food import compliance is a material cost centre for agri commodity buyers — and one that varies significantly by origin country, destination market, and product category.
UK import compliance costs for Indian food products (illustrative):
- Import Entry: £40–80 per shipment (customs broker fee)
- Documentary check: variable (HMRC officer time)
- Physical inspection at Border Control Post: £300–600 per inspection (frequency determined by product risk category)
- Lab testing if selected for analysis: £200–800 per test
- Certificate of Conformity (where required): £150–300
For buyers receiving monthly shipments, these costs aggregate to £7,000–15,000 annually — a material figure that should appear in TCO calculations, not in a separate compliance budget.
A supplier with impeccable documentation reduces the frequency of physical inspections (UK/EU authorities apply reduced inspection frequencies to consistently compliant suppliers). Over time, a compliant, well-documented supplier from India costs significantly less to import from than a cheaper supplier whose documentation quality triggers systematic additional checks.
Section 6 — Building Your TCO Model
A TCO model does not need to be complex to be useful. A structured spreadsheet covering the cost categories above, applied consistently across your supplier comparisons, will reveal the insights that price-only comparison misses.
Implementation steps:
- Define your cost categories — adapt the framework above to your specific commodity and trade lane
- Estimate cost values — use actual data where available, industry benchmarks where not
- Quantify risk provisions — assign a cost to quality rejection risk, compliance failure risk, and supply disruption risk based on each supplier’s historical performance
- Calculate TCO per unit — divide total annual cost by volume to get a per-unit comparison
- Sensitivity test — vary key assumptions (freight rates, rejection rates, compliance frequency) to understand which costs most influence the outcome
- Review annually — TCO is not a static calculation; freight rates, regulatory requirements, and supplier performance change
Practical Takeaways
- Invoice price is the starting point of supplier evaluation, not the endpoint.
- Quality rejection rate and documentation compliance are the two highest-impact hidden cost drivers in agri food procurement.
- Incoterm selection has material TCO implications — model freight costs under each term before negotiating.
- Compliance costs vary significantly by origin-destination pair and supplier quality — include them in every sourcing analysis.
- Switching costs are a real economic barrier to changing suppliers — quantify them before assuming a cheaper supplier is worth the transition cost.
Conclusion
The procurement professional who optimises invoice price alone is optimising for the wrong outcome. Total cost of ownership thinking reframes the sourcing decision around the question that actually matters: which supplier delivers the most value to the business across all the costs associated with the relationship?
For agri and food commodity buyers, TCO analysis consistently reveals that quality, compliance, and reliability are worth paying for — because the cost of their absence is invariably higher than the premium required to secure them.
Build the model, run the numbers, and make decisions that reflect the full economic reality of your sourcing choices.
FAQ Section
Q: How much time does TCO analysis take to implement?
A: A basic TCO model can be built in a few hours for a single commodity. The more useful investment is building a reusable template that can be applied consistently across all supplier comparisons going forward.
Q: Can I apply TCO analysis to existing suppliers, not just new ones?
A: Absolutely — and this is often where the most significant insights emerge. Auditing your current supplier base through a TCO lens frequently reveals that your “cheapest” supplier is not your lowest-cost supplier.
Q: What data do I need to build a TCO model?
A: Start with: invoice prices, freight costs, customs broker fees, quality rejection rates, documentation error rates, and compliance inspection costs. Most of this data already exists in your ERP, accounts payable records, and quality management system.
Q: How do I account for risks I cannot easily quantify?
A: Assign a probability-weighted cost to key risk events. For example, if a supplier has a 10% chance of a major quality failure in a year, and a major failure costs £20,000, the risk provision is £2,000. This is an estimate, but it is more accurate than treating the risk as zero.
Q: Does TCO analysis favour Indian suppliers?
A: TCO analysis is neutral — it reflects the costs associated with any supplier relationship. Indian agri exporters with strong certifications (FSSAI, ISO 22000, HACCP, GMP) and reliable documentation tend to perform well in TCO comparisons because their compliance profile reduces inspection frequency and quality failure costs.
Key Takeaways
- TCO includes acquisition, logistics, compliance, quality failure, and relationship management costs.
- A 7% invoice price advantage can be fully offset by higher hidden costs.
- Quality rejection rate is typically the highest-value hidden cost to reduce.
- Incoterm selection and compliance costs are material TCO drivers that are frequently underestimated.
- TCO models should be reviewed annually as freight rates, regulations, and supplier performance change.
Purolean Global exports premium agri and food commodities from India — including cold pressed coconut, groundnut, and sesame oils — with full FSSAI, ISO 22000, HACCP, and GMP certification. Our documentation compliance rate consistently exceeds 98%. Contact us to discuss your sourcing requirements.
CTA: Speak with our export team about your procurement needs.
→ [Contact Purolean Global at purolean.com]