Introduction
Most procurement teams have opinions about which suppliers are good and which are difficult. Fewer have data.
The gap between opinion and data is where supplier relationship management breaks down. When a supplier’s performance deteriorates gradually — quality rejection rates creeping up, documentation errors increasing, lead times lengthening — it is easy to miss the trend if you are managing by feel rather than by measurement. By the time the problem is obvious, it has already cost you significantly.
A supplier scorecard solves this problem by creating a consistent, structured measurement of supplier performance across the dimensions that matter most to your business. It converts a qualitative judgement — “Supplier X is generally reliable” — into a quantitative assessment: “Supplier X scores 7.8/10 overall, with strong quality performance (9.2) offset by below-benchmark documentation accuracy (5.5) that is trending downward.”
That data is actionable in a way that an opinion is not.
Section 1 — What to Measure: The Five Scorecard Dimensions
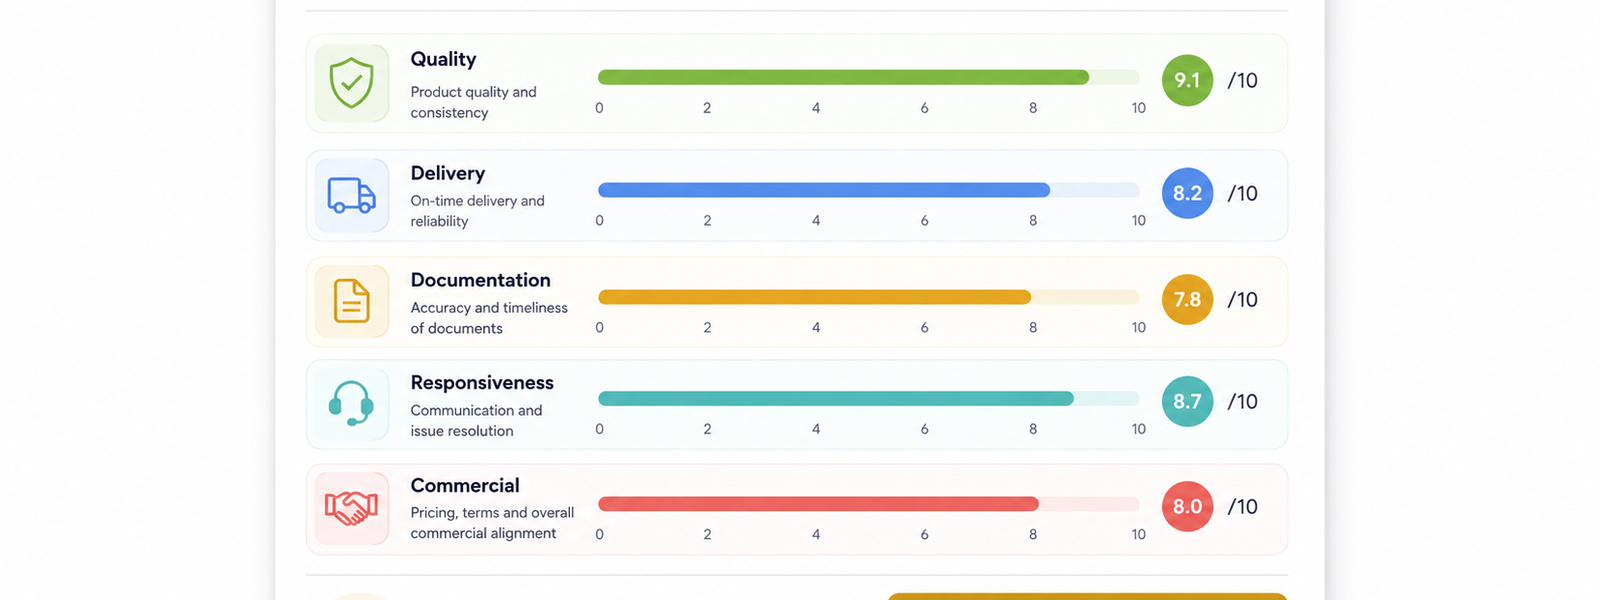
An effective supplier scorecard for agri food procurement measures performance across five dimensions. Together, these capture the full picture of supplier value delivery.
Dimension 1: Quality Performance (25% weight)
Quality is the highest-weight dimension because quality failures have the largest and most unpredictable cost consequence in food procurement.
Metrics to include:
– Quality acceptance rate (target: ≥99%) — percentage of deliveries accepted without rejection or rework
– Specification conformance — percentage of tested parameters within specification on incoming quality checks
– Certificate of Analysis accuracy — match between CoA stated values and actual test results
– Complaint response rate — percentage of quality complaints acknowledged within 24 hours and resolved within agreed SLA
Dimension 2: Delivery Performance (20% weight)
Delivery performance measures whether the supplier delivers the right quantity at the right time.
Metrics to include:
– On-time delivery rate (target: ≥95%) — percentage of shipments delivered within the agreed lead time window
– Lead time consistency — standard deviation of actual lead time versus quoted lead time (lower = better)
– Order fulfilment rate — percentage of ordered quantity delivered in full (no short-shipments without advance notice)
Dimension 3: Documentation and Compliance (20% weight)
In international food trade, documentation is not administrative — it is the mechanism through which your goods are permitted to enter the destination market. Documentation failures are not nuisances; they are supply chain events.
Metrics to include:
– Documentation accuracy rate (target: ≥98%) — percentage of shipments with complete, accurate, and compliant documentation on first submission
– Certification currency — percentage of required certifications (FSSAI, ISO 22000, HACCP, GMP, organic, halal where relevant) current and without lapses
– Customs clearance success rate — percentage of shipments cleared at the first attempt without documentation-related queries
Dimension 4: Responsiveness and Communication (20% weight)
How a supplier communicates — and how quickly they respond — is a genuine indicator of their operational capability and commitment to the relationship.
Metrics to include:
– Enquiry response time — average time to acknowledge and respond to commercial, quality, or logistics enquiries
– Proactive communication score — subjective rating (1–5) of whether the supplier alerts you to issues before you discover them
– Issue resolution time — average time from issue raised to resolution confirmed
– Senior engagement quality — access to decision-makers when needed
Dimension 5: Commercial and Sustainability (15% weight)
This dimension captures the broader commercial relationship and responsible sourcing factors that increasingly matter to buyers and their downstream customers.
Metrics to include:
– Price competitiveness — annual price benchmarking against market and alternative suppliers
– Pricing transparency — willingness to share cost breakdown and raw material price data
– Sustainability credentials — certifications held (organic, Rainforest Alliance, Fair Trade), traceability documentation, and environmental management practices
– Financial stability indicators — payment terms compliance, business continuity evidence, and financial health signals
Section 2 — Scoring Methodology
The scoring methodology must balance simplicity (so it is actually used) with rigour (so the scores mean something).
Recommended approach: 1–10 scale with anchor definitions
For each metric, define what a score of 2, 5, 8, and 10 looks like. This removes subjectivity from individual scores and ensures consistency across scorers.
Example anchor definitions for Quality Acceptance Rate:
| Score | Performance Level |
|---|---|
| 10 | 100% acceptance rate across all deliveries in the period |
| 8 | 99–99.9% acceptance rate — one minor issue |
| 6 | 97–99% acceptance rate — occasional rejections, promptly resolved |
| 4 | 95–97% acceptance rate — recurring quality issues under management |
| 2 | Below 95% acceptance rate — significant quality concern |
Weighting the dimensions:
Apply the percentage weights to each dimension score to calculate a weighted overall score:
Overall Score = (Quality × 0.25) + (Delivery × 0.20) + (Documentation × 0.20) + (Responsiveness × 0.20) + (Commercial × 0.15)
Performance thresholds:
| Overall Score | Classification | Action |
|---|---|---|
| 8.5–10.0 | Preferred Supplier | Prioritise for volume; develop partnership |
| 7.0–8.4 | Approved Supplier | Maintain; identify improvement priorities |
| 5.5–6.9 | Improvement Required | Issue formal improvement plan; monitor monthly |
| Below 5.5 | At Risk | Qualify alternative; consider exit |
Section 3 — Data Collection and Review Cadence
A scorecard is only as good as the data that feeds it. Establishing clear data collection responsibilities is essential.
Data sources by dimension:
- Quality — incoming quality inspection records, lab test results, rejection logs (procurement / quality team)
- Delivery — goods receipt records, shipping documents, logistics tracking data (logistics / warehouse)
- Documentation — shipment documentation files, customs clearance records, certification register (compliance / procurement)
- Responsiveness — email response tracking, CRM records, subjective rating from buyer (procurement relationship owner)
- Commercial — price benchmarking, contract compliance records, sustainability audit reports (procurement / CSR)
Review cadence:
| Supplier Tier | Scorecard Frequency | Review Meeting |
|---|---|---|
| Strategic (>£500k spend) | Monthly | Quarterly senior review |
| Preferred (£100k–500k) | Quarterly | Semi-annual review |
| Approved (<£100k) | Semi-annual | Annual review |
Section 4 — Using Scorecard Data in Supplier Conversations
The scorecard’s purpose is not surveillance — it is improvement. How you use the data in supplier conversations determines whether it drives better performance or damages the relationship.
Principles for productive scorecard conversations:
-
Share the scorecard format before using it — suppliers should know what you measure and how before they are measured. Surprises in a performance review damage trust.
-
Present data, not judgements — “Your documentation accuracy score is 6.2 against a target of 8.0, driven by three shipments in Q1 with incomplete phytosanitary certificates” is a productive conversation starter. “Your documentation is consistently poor” is not.
-
Focus on trends, not snapshots — a single quarter’s data is rarely definitive. Three quarters of deteriorating delivery performance is a pattern worth addressing directly.
-
Ask for the supplier’s perspective — documentation errors and delivery delays often have root causes that the supplier can identify and address. The best improvement plans are co-developed.
-
Connect scores to commercial consequences — make explicit the link between scorecard performance and volume allocation, contract renewal, and strategic partner status. Suppliers respond to commercial incentives.
Section 5 — Scorecard Implementation: Common Mistakes
Mistake 1: Measuring too many things
A scorecard with 30 metrics becomes a reporting burden rather than a management tool. Focus on 12–18 metrics across the five dimensions. Less is more.
Mistake 2: Not sharing results with suppliers
A scorecard that is completed internally but never shared with the supplier drives no improvement. The point is the conversation it enables, not the score itself.
Mistake 3: Scoring without anchor definitions
Without anchor definitions, two buyers scoring the same supplier on the same metric may produce very different scores. The scoring becomes an expression of individual mood rather than an objective assessment.
Mistake 4: Ignoring scores when making decisions
If the scorecard shows a supplier is at risk but they continue to receive full volume allocation because “the relationship is difficult to exit,” the measurement system has no credibility. Scorecard results must influence real decisions.
Key Takeaways
- A supplier scorecard converts subjective supplier management into objective performance accountability — essential for catching deteriorating performance before it becomes a crisis
- The five dimensions for agri food procurement: quality, delivery, documentation, responsiveness, and commercial/sustainability
- Score on a 1–10 scale with anchor definitions for each metric to remove subjectivity
- Share the scorecard format with suppliers before using it — the goal is improvement, not surveillance
- Review frequency should match supplier strategic importance: strategic suppliers monthly, preferred suppliers quarterly
FAQ
Q: Should I tell suppliers they are being scored?
A: Yes, absolutely. Transparency is more effective than surveillance. Suppliers who know what is being measured and how scores are used are more likely to focus on the right things.
Q: How do I handle suppliers who refuse to participate in scorecard reviews?
A: A supplier’s refusal to engage with performance reviews is itself a significant data point about their commitment to the relationship. It should factor into the overall assessment.
Q: Can I use the same scorecard for all commodity categories?
A: The dimension structure can be consistent, but the weighting and specific metrics should reflect each category’s risk profile. A fresh produce supplier should have a higher weight on delivery consistency than a packaged dry goods supplier.
Q: How long does it take to implement a supplier scorecard?
A: A basic scorecard for your top 10 suppliers can be designed in two weeks and implemented in one month. Full data quality for all metrics typically takes one to two quarters to achieve.
Conclusion
A supplier scorecard is not bureaucracy — it is the foundation of a supplier management approach that is fair to suppliers, defensible to stakeholders, and genuinely effective at driving performance improvement.
For food and agri buyers, where the consequences of supplier failure are regulatory, operational, and reputational, the investment in measurement is small relative to the value it protects.
Start with your top five suppliers by spend. Define what you will measure and how. Share the framework before you score. Run one cycle before making any consequential decisions. The discipline will compound over time into a supplier portfolio that is measurably better than the one you started with.
Purolean Global maintains full certification compliance and welcomes supplier scorecard processes from international buyers. Contact us at global.purolean.com
Internal Links
- → Commodity Market Intelligence: The Procurement Leader’s Guide
- → How Procurement Teams Evaluate New Supplier Markets
- → Total Cost of Ownership in Food Procurement
- → The Modern Procurement Playbook
- → 4 Pillars of Supply Chain Resilience
External Authority Links
- CIPS Supplier Relationship Management Guide — https://www.cips.org/knowledge/procurement-topics-and-skills/supplier-management/
- ISO 9001 Supplier Evaluation Requirements — https://www.iso.org/standard/62085.html