Introduction
In most organisations, commodity price management follows a reactive pattern: prices rise, leadership asks questions, procurement scrambles for answers, and decisions are made under pressure with incomplete information. The next cycle brings the same experience.
This pattern is not inevitable. It is the consequence of treating commodity market intelligence as an ad hoc activity rather than a systematic function.
The procurement teams that avoid this cycle share a common characteristic: they have built — or have access to — an ongoing intelligence function that tracks commodity price drivers, monitors supply-demand dynamics, and translates market signals into sourcing decisions before the rest of the market has reacted.
For food and agri procurement professionals sourcing from international origins, commodity market intelligence is not a luxury. The commodities involved — cold pressed oils, spices, pulses, fresh produce — are subject to price movements driven by monsoon patterns, export policy decisions, currency fluctuations, and geopolitical developments that are both significant and, to a meaningful degree, anticipatable.
This guide provides the framework for building that intelligence capability.
Section 1 — What Commodity Market Intelligence Is (and Is Not)
Commodity market intelligence is the systematic process of collecting, analysing, and acting on information about the factors that drive commodity prices, availability, and supply chain conditions.
It is not:
– Checking spot prices weekly on a commodity exchange
– Reading a monthly industry newsletter
– Asking your supplier what they think prices will do
Those activities are data collection without analysis or action. Intelligence requires the additional steps: interpreting what the data means, forecasting how it will translate into price and availability, and converting the forecast into a procurement decision.
The intelligence cycle for commodity procurement:
- Monitor — track the leading indicators that drive your commodity’s price (crop production data, export policy signals, freight indices, currency rates, seasonal patterns)
- Analyse — interpret what the indicators suggest about near-term price direction and supply availability
- Forecast — develop a forward view on price range and supply conditions over the relevant procurement horizon (typically 3–6 months)
- Decide — translate the forecast into a sourcing action: buy forward, wait, increase safety stock, qualify alternative origins, renegotiate contract terms
- Review — assess forecast accuracy and decision quality to improve the next cycle
The difference between organisations that manage commodity risk well and those that don’t is almost always the discipline to run this cycle consistently — not the sophistication of their data sources.
Section 2 — The Key Commodities and Their Price Drivers
Different agri commodities are driven by different underlying factors. Effective intelligence requires understanding which drivers matter most for each commodity in your portfolio.
Cold Pressed Coconut Oil
Coconut oil prices are primarily driven by:
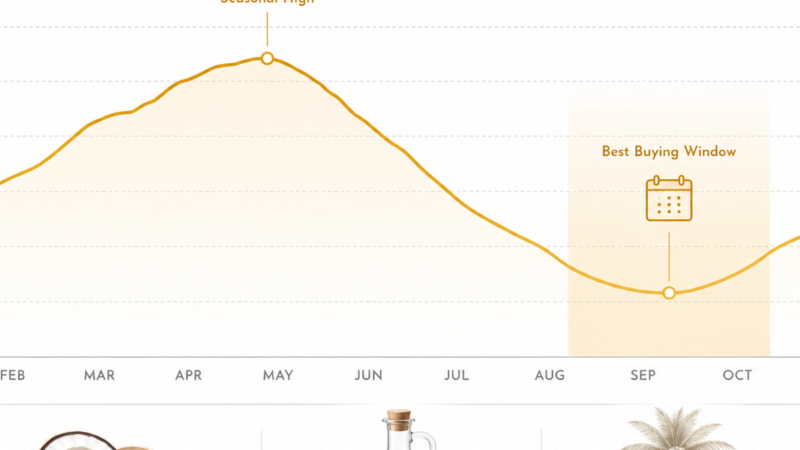
– Philippine and Indonesian production — these two countries account for the majority of global copra supply. Typhoon seasons, El Niño/La Niña cycles, and planting-to-harvest lags (3 years for new palms) create multi-year supply cycles.
– Indian production and export policy — India is a significant coconut oil producer, and changes to FSSAI standards, export promotion schemes, or import duties affect trade flows.
– Competing oil prices — coconut oil competes with palm oil, sunflower oil, and other vegetable oils. When sunflower oil prices spike (as in 2022), demand shifts toward coconut oil, driving prices up.
– Consumer demand trends — growing Western demand for cold pressed, organic coconut oil has structurally increased the premium for food-grade, certified product.
Cold Pressed Sesame Oil
Sesame oil prices are driven by:
– Indian and African sesame production — India (Rajasthan, Gujarat, Madhya Pradesh) and East Africa (Sudan, Ethiopia, Tanzania) are the primary origins. Crop conditions in these regions, particularly rainfall in the June–August growing season, are the primary short-term price driver.
– Chinese demand — China is both a major producer and a major importer of sesame and sesame oil. Changes in Chinese buying patterns have an outsized effect on global prices.
– Crop quality and oil content — sesame price is partly driven by seed oil content (%), which varies by origin and growing conditions.
Cold Pressed Groundnut (Peanut) Oil
Groundnut oil prices are driven by:
– Kharif crop production in India — the primary growing season (June–October) determines the crop volume. Drought, excess rainfall, or pest pressure during this period directly affects supply and price.
– Gujarat production specifics — Gujarat produces the majority of India’s groundnut crop. State-specific conditions matter more than national aggregates.
– Competing oil prices — groundnut oil competes with other cooking oils. When palm oil is cheap, groundnut oil buyers have an alternative.
– Aflatoxin risk — groundnuts are susceptible to aflatoxin contamination. A high-contamination season can remove significant supply from the premium food-grade market.
Section 3 — Data Sources That Matter
A commodity intelligence function requires a portfolio of data sources. Not all sources are equally valuable or equally timely.
Tier 1 — Leading indicators (highest value)
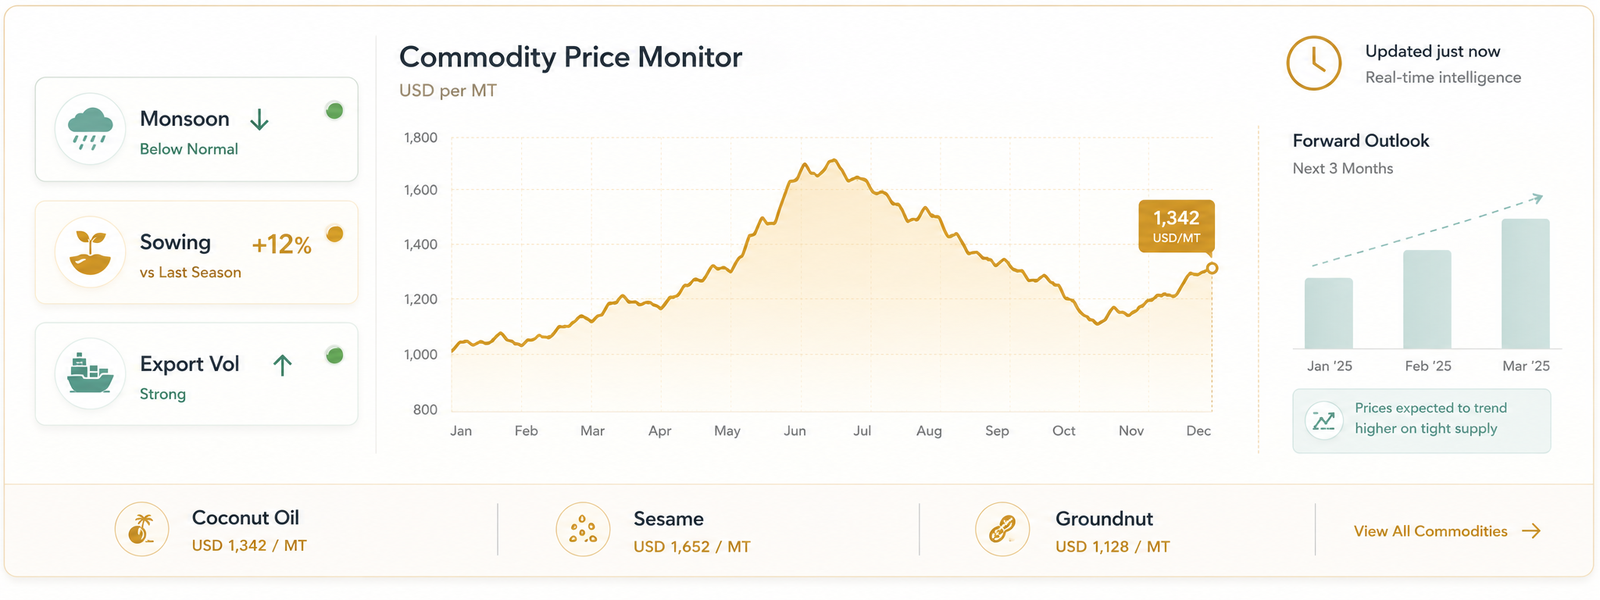
- Crop area and sowing data — India’s Ministry of Agriculture releases weekly Kharif sowing data during the growing season. Early sowing progress relative to the prior year is a leading indicator of eventual supply.
- Monsoon data — India Meteorological Department (IMD) monsoon tracking, particularly regional rainfall versus normal (% departure from long-period average) for key growing states.
- Export data — APEDA (Agricultural and Processed Food Products Export Development Authority) releases monthly export data for Indian agricultural commodities. Rising export volumes indicate tight domestic supply.
- Government procurement and MSP — India’s Minimum Support Price (MSP) for agricultural commodities sets a floor for farmer selling prices and signals government policy direction.
Tier 2 — Coincident indicators (useful for confirmation)
- Spot and futures prices — NCDEX (National Commodity and Derivatives Exchange, India), CME Group, and international commodity exchanges provide current price data.
- Freight rate indices — Baltic Dry Index (BDI), SCFI (Shanghai Containerized Freight Index), and India-specific freight rates indicate logistics cost trends.
- Currency rates — INR/USD, INR/GBP, INR/EUR affect the landed cost of Indian origin commodities in destination markets.
Tier 3 — Lagging indicators (useful for trend confirmation)
- Trade statistics — UN Comtrade, DGCI&S (Directorate General of Commercial Intelligence and Statistics, India) provide detailed trade flow data with a 1–2 month lag.
- Industry reports — USDA WASDE (World Agricultural Supply and Demand Estimates), FAO commodity outlooks, and IIPR reports provide comprehensive supply-demand analysis.
Free vs. paid sources:
Most Tier 1 and Tier 2 data is available free from government sources. Paid services (Mintec, Agricensus, Strategie Grains) add analytical value through synthesis and proprietary forecasting — worth investing in for high-spend commodities.
Section 4 — Building the Intelligence Function: Practical Steps
For most mid-sized procurement operations, a commodity intelligence function does not require a dedicated analyst or expensive software. It requires systematic habits applied consistently.
Step 1: Define your commodity portfolio
List every commodity you source where a 10% price movement would materially affect your cost base. For most food and agri buyers, this list has 5–15 items. Prioritise by spend volume × price volatility.
Step 2: Identify the three leading indicators for each commodity
For each commodity in your portfolio, identify the three data points that most consistently lead price movements by 2–4 months. These become your monitoring priorities.
Step 3: Build a monthly intelligence brief
Once per month (or more frequently for high-spend categories), produce a one-page brief for each key commodity covering: current price, 3-month trend, leading indicator status, and a 3-month price direction call (rising/stable/falling, with confidence level).
Step 4: Translate intelligence into decisions
The brief is only useful if it triggers action. Define in advance what actions different forecast scenarios should trigger:
– Rising price forecast → consider forward purchase or price lock
– Falling price forecast → delay large purchases, avoid long-term price commitments
– Supply disruption risk → qualify alternative origins, increase safety stock
– Currency movement → model landed cost impact and consider hedging
Step 5: Review and calibrate
Every quarter, review your forecasts against actual outcomes. Where were you most accurate? Where did you miss? Use this to improve your leading indicator selection and forecast methodology.
Section 5 — Using Intelligence in Supplier Negotiations
One of the highest-value applications of commodity market intelligence is supplier negotiation. A procurement team that understands the commodity market better than their supplier — or at least as well — negotiates from a fundamentally stronger position.
Practical negotiation applications:
- Timing negotiations when intelligence favours you — if your forecast indicates prices are likely to fall, delay contract renewals. If prices are likely to rise, lock in volume at current rates.
- Challenging supplier price increase claims — when a supplier requests a price increase citing “rising raw material costs,” your intelligence should allow you to verify whether the claimed cost increase is real, proportionate, and permanent.
- Demonstrating market knowledge — suppliers who understand that their buyer is well-informed are less likely to attempt opportunistic price increases. Market knowledge itself is a deterrent.
- Building credibility for long-term partnerships — suppliers prefer buyers who understand the market. Demonstrating intelligence capability signals that you are a serious, long-term partner worth investing in.
Key Takeaways
- Commodity market intelligence is a systematic cycle — monitor, analyse, forecast, decide, review — not an ad hoc data-checking exercise
- Different commodities are driven by different leading indicators; effective intelligence requires knowing which ones matter for each category in your portfolio
- Most valuable data sources are free government releases — monsoon data, sowing progress, export figures — that consistently lead price by 2–4 months
- The goal of intelligence is not perfect forecasting — it is making better decisions more often than you would without it
- Market intelligence directly improves supplier negotiation: timing, price challenge capability, and positioning as a sophisticated buyer
FAQ
Q: How much time does a commodity intelligence function require?
A: For a portfolio of 5–10 commodities, a systematic monthly brief takes 4–6 hours per month once the data sources are established. The investment pays back in a single well-timed purchase decision.
Q: Do I need specialist software or a data provider?
A: Not initially. Government data sources (IMD, APEDA, NCDEX) provide sufficient leading indicator data for most procurement applications at no cost. Paid services add value for high-spend categories once your intelligence process is mature.
Q: How far ahead can commodity prices reliably be forecast?
A: Agricultural commodity prices can be directionally forecast 2–4 months ahead with moderate reliability, based on leading crop and weather indicators. Beyond 4 months, confidence decreases significantly. The goal is directional accuracy, not precision.
Q: What is the most common intelligence failure in procurement?
A: Collecting data without acting on it. Many procurement teams gather market information but do not have a defined decision framework that translates the information into sourcing actions. Intelligence without action is just reporting.
Q: How does Purolean support buyers with commodity intelligence?
A: Purolean provides regular market updates on Indian agri commodity price trends — including cold pressed coconut, sesame, and groundnut oil — as part of its buyer support service. Contact us at global.purolean.com for access.
Conclusion
Commodity market intelligence is one of the most valuable and most underdeveloped capabilities in food and agri procurement. The organisations that invest in it systematically — even at a modest level — consistently outperform those that react to price movements after the fact.
The framework is not complex: identify your key commodities and their leading indicators, build a monthly monitoring habit, translate your forecasts into defined actions, and review your accuracy. That discipline, applied consistently, creates a meaningful and durable competitive advantage in commodity cost management.
For buyers sourcing agri commodities from India, the intelligence infrastructure is particularly strong — government data is detailed, timely, and freely available. The opportunity is there. The question is whether your procurement function is structured to use it.
Subscribe to Purolean Trade Intelligence for monthly commodity market updates covering cold pressed oils, spices, and Indian agri commodities. Visit global.purolean.com
Internal Links
- → Geopolitical Risk & Global Food Supply Chains
- → Total Cost of Ownership in Food Procurement
- → 4 Pillars of Supply Chain Resilience
- → How Procurement Teams Evaluate New Supplier Markets
- → Trade Route Disruptions: Procurement Planning 2025
External Authority Links
- USDA WASDE Reports — https://www.usda.gov/oce/commodity/wasde/
- APEDA India Export Statistics — https://agriexchange.apeda.gov.in/