Introduction
“You manage what you measure” is one of those management aphorisms that becomes a problem when the wrong things are being measured.
In procurement, the most commonly tracked KPIs — cost savings achieved, number of suppliers reviewed, purchase order cycle time — are easy to calculate and easy to report. They are also frequently disconnected from the outcomes that actually matter to the business: supply continuity, quality consistency, total landed cost, and supplier relationship health.
For food and agri procurement teams, the mismatch between what is measured and what matters is particularly consequential. A procurement function that reports strong cost savings while accumulating quality rejection costs, building excessive safety stock to compensate for unreliable supply, and managing a series of supplier relationship crises is not performing well — regardless of what its cost savings dashboard shows.
Building a procurement measurement framework that captures the right things requires stepping back from convention and asking: what does high-performing food and agri procurement actually look like, and how would we know if we were achieving it?
Section 1 — The KPIs Most Teams Track (and Why They’re Incomplete)
Commonly tracked but limited KPIs:
Cost savings achieved (£ or %)
The most universally reported procurement KPI measures the difference between what was paid and what would have been paid without procurement’s intervention. The problem: cost savings can be inflated by unrealistic reference prices, disguised by shifted costs (lower unit price, higher quality rejection rate), or generated at the expense of supply reliability. Cost savings as the primary KPI encourages short-term price focus at the expense of total value.
On-time delivery rate (%)
A valuable metric, but it measures what the supplier delivers, not what the supplier is capable of. A supplier with a 95% on-time delivery rate who delivers the 5% late orders during critical production periods is a bigger supply risk than a supplier with a 90% overall on-time rate whose late deliveries are non-critical.
Number of suppliers / supplier rationalisation progress
A metric that reflects procurement strategy activity but not outcomes. Fewer suppliers can mean better-managed concentration risk — or simply higher unmanaged single-source risk. The number is meaningless without the context of what the supplier base is actually delivering.
Purchase order processing time
An efficiency metric, not a value metric. Relevant for high-volume transactional procurement; largely irrelevant for strategic commodity sourcing where relationship quality matters far more than transaction speed.
Section 2 — The KPIs That Actually Drive Performance
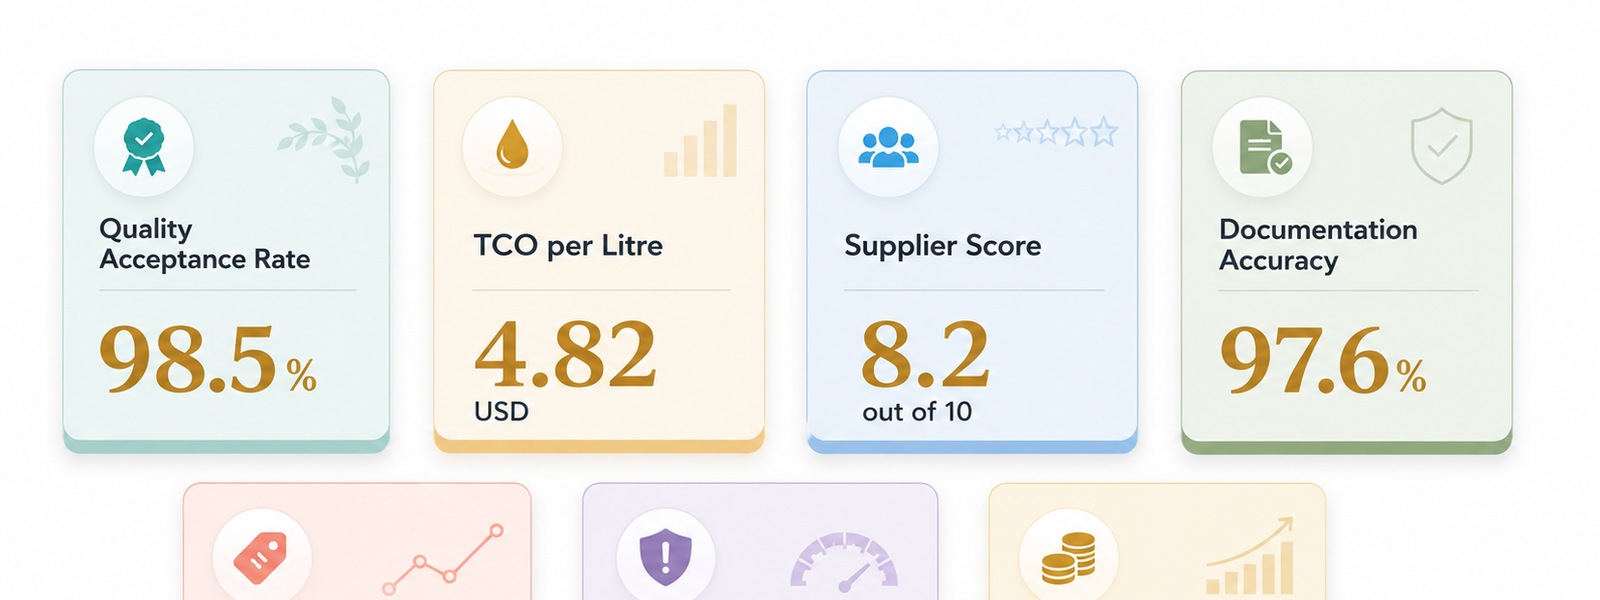
KPI 1: Total Cost of Ownership per unit (£/kg or £/litre)
What it measures: The complete cost of acquiring, receiving, and consuming a unit of a commodity — including unit price, freight, customs, quality management, waste, and management overhead.
Why it matters: The only cost metric that captures whether procurement is genuinely delivering value or simply shifting cost to other parts of the business.
How to calculate: (Total procurement spend + total freight + total quality costs + total compliance costs + total management overhead) ÷ total units received
Target: Downward trend year-on-year, with commodity price movements stripped out.
KPI 2: Quality Acceptance Rate (%)
What it measures: The percentage of incoming deliveries accepted without rejection, rework, or quality-related cost.
Why it matters: Quality rejection is one of the highest-cost supply chain events in food procurement. A 1% improvement in acceptance rate on a £1m annual spend can save £20,000+ when full rejection costs are counted.
How to calculate: (Deliveries accepted without quality issue ÷ total deliveries received) × 100
Target: ≥99% for certified, strategic suppliers.
KPI 3: Supply Continuity Risk Score
What it measures: A composite assessment of your supply chain’s vulnerability to disruption — measured before disruptions occur, not after.
Why it matters: Most supply chain risk metrics are lagging (they measure disruptions that have already occurred). A leading risk score allows preventive action.
How to construct: Score each key commodity on: number of qualified sources (1–5), origin risk (1–5), safety stock level relative to lead time (1–5), and supplier financial health (1–5). Aggregate into a per-commodity risk score that is reviewed quarterly.
Target: No critical commodity at a combined risk score above threshold; all high-risk categories have qualified secondary suppliers and appropriate buffer stock.
KPI 4: Supplier Scorecard Average (0–10)
What it measures: The weighted average performance score across your strategic supplier portfolio, covering quality, delivery, documentation, responsiveness, and commercial dimensions.
Why it matters: A single number that summarises the health of your supplier portfolio. Trends in this metric predict future supply and quality performance before problems materialise in financial outcomes.
How to calculate: Average of scorecard scores across strategic and preferred suppliers, weighted by spend.
Target: Portfolio average ≥8.0; no strategic supplier below 7.0 without an active improvement plan.
KPI 5: Documentation Accuracy Rate (%)
What it measures: The percentage of shipments with complete, accurate, and compliant documentation on first submission — without corrections, resubmissions, or queries from customs.
Why it matters: Documentation failures are a direct cost (customs delays, inspection fees, broker correction charges) and an indirect cost (management time, relationship stress, production planning disruption). In the UK and EU food import context, they can also trigger enhanced surveillance and increased inspection frequency.
How to calculate: (Shipments with clean documentation on first submission ÷ total shipments) × 100
Target: ≥98% for established suppliers.
KPI 6: Savings Realisation Rate (%)
What it measures: The proportion of negotiated savings that are actually realised in landed costs — net of any cost offsets elsewhere in the supply chain.
Why it matters: Many reported savings are not realised — they are offset by higher freight, lower quality, or increased management cost. The savings realisation rate tracks the conversion from negotiated outcome to actual P&L benefit.
How to calculate: (Actual year-on-year cost reduction at commodity-adjusted landed cost basis ÷ savings target at start of year) × 100
Target: ≥85% realisation rate.
KPI 7: Price Achievement vs Market Index (%)
What it measures: How your achieved purchase prices compare to the relevant commodity market index — are you buying at, above, or below market?
Why it matters: Cost savings measurements tell you how much less you paid than a benchmark, but market index comparison tells you whether your purchasing strategy is actually capturing market opportunities.
How to calculate: (Achieved purchase price ÷ relevant market index price at time of purchase) × 100. Below 100% = buying below market; above 100% = paying above market.
Target: Average of ≤100% for key commodity categories over a rolling 12-month period.
Section 3 — Building a Procurement Dashboard
A procurement dashboard for food and agri buyers should be structured to answer three questions:
- How are we performing this month? (Operational view)
- How is our supplier portfolio performing? (Relationship view)
- What risks are we carrying? (Risk view)
Recommended dashboard structure:
| View | Key Metrics | Frequency |
|---|---|---|
| Operational | TCO per unit (vs prior period), Quality acceptance rate, Documentation accuracy rate | Monthly |
| Supplier Portfolio | Average scorecard score (by tier), Number of suppliers with active improvement plans, Supplier-reported issues | Quarterly |
| Risk | Supply continuity risk score by commodity, Safety stock level vs target, Qualified source count per commodity | Quarterly |
| Commercial | Price achievement vs market index, Savings realisation rate, Forward coverage level | Monthly |
Section 4 — Implementation: Starting Small and Building Up
Phase 1 (Month 1–2): Baseline measurement
Before optimising, measure. For each key commodity: calculate current TCO per unit, document current quality acceptance rate, and complete a supply continuity risk score. This baseline is the starting point for improvement tracking.
Phase 2 (Month 3–6): Supplier data integration
Work with your top five suppliers to establish regular reporting of the metrics that require their input (quality parameters, documentation accuracy, on-time delivery). Not all data will be perfect initially — the process of establishing measurement is itself valuable.
Phase 3 (Month 7–12): Dashboard operationalisation
Produce the first monthly dashboard and share it with senior leadership. Use it in supplier review meetings. Begin tracking trends.
Phase 4 (Year 2): Decision integration
By Year 2, KPI trends should be routinely informing sourcing decisions: volume allocation, contract renewal, supplier development investment. This is when the measurement system begins generating genuine commercial value.
Key Takeaways
- The most commonly tracked procurement KPIs (cost savings, on-time delivery, supplier count) are incomplete — they miss total cost, quality risk, and supply continuity
- The KPIs that drive actual procurement performance: TCO per unit, quality acceptance rate, supply continuity risk score, supplier scorecard average, documentation accuracy, savings realisation rate, price vs market index
- A procurement dashboard should answer three questions: how are we performing operationally, how healthy is our supplier portfolio, and what risks are we carrying?
- Start with baseline measurement — you cannot improve what you have not measured
- KPIs should inform real decisions: volume allocation, contract renewal, and supplier development investment
FAQ
Q: How many KPIs should a procurement team track?
A: 6–10 KPIs across the three views (operational, supplier portfolio, risk) is appropriate for most food procurement functions. More than 15 creates reporting burden without improving decisions.
Q: Should KPI targets be fixed or adjusted for market conditions?
A: Some targets are fixed (quality acceptance rate, documentation accuracy). Others (price achievement vs market index, TCO trend) should be interpreted in the context of market conditions — a rising commodity market changes the context for absolute cost metrics.
Q: How do I get supplier agreement to provide performance data?
A: Frame it as mutual benefit — the scorecard data improves the supplier’s understanding of your requirements and their performance against them. Most well-managed suppliers welcome structured performance feedback; reluctance to engage is itself a signal.
Q: What is a reasonable timeline to see KPI improvement after implementing a measurement framework?
A: Quality and documentation metrics typically improve within 1–2 supplier review cycles (3–6 months) once suppliers know they are being measured. TCO and risk metrics improve over a longer horizon as sourcing strategy adjustments take effect.
Conclusion
Procurement measurement is not about creating reporting burden — it is about creating the information that enables better decisions. The KPIs that matter in food and agri procurement are those that capture total value, supply risk, quality risk, and supplier relationship health.
Building that measurement framework takes time and requires supplier cooperation. But the investment compounds: procurement teams that measure the right things make better sourcing decisions, build stronger supplier relationships, and manage supply risk more effectively than those that don’t.
The measure-to-manage cycle — baseline, monitor, decide, review — is the foundation of a procurement function that genuinely creates value rather than simply reports it.
Subscribe to Purolean Trade Intelligence for monthly insights on commodity markets, procurement best practice, and India agri export trends. Visit global.purolean.com
Internal Links
- → Supplier Scorecard for Agri Food Procurement
- → Total Cost of Ownership in Food Procurement
- → The Modern Procurement Playbook
- → Commodity Market Intelligence: The Procurement Leader’s Guide
- → Building Long-Term Supplier Relationships
External Authority Links
- CIPS Procurement Analytics and KPIs — https://www.cips.org/knowledge/procurement-topics-and-skills/performance-measurement/
- Hackett Group Procurement Benchmarking — https://www.thehackettgroup.com/research/procurement/